These are up-to-date values for Rt, a key measure of how fast the virus is growing. It’s the average number of people who become infected by an infectious person. If Rt is above 1.0, the virus will spread quickly. When Rt is below 1.0, the virus will stop spreading: https://rt.live/. As of today (4/20/2020), Florida is just below 1.0 – let’s hope we can push it down (but our Governor has just re-opened the beaches, so let’s see where we are in two weeks).
The COVID-19 dashboard from Johns Hopkins – contains worldwide information: Coronavirus COVID-19
Another dashboard from Johns Hopkins – US focused – that has county level breakdowns. COVID-19 United States Cases
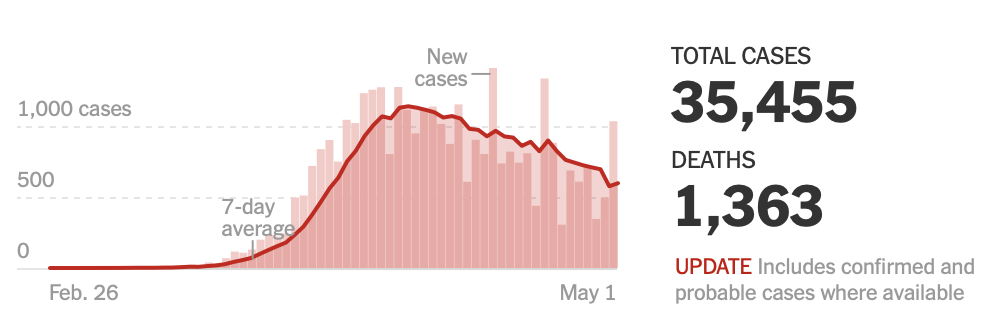
Added on 5/3/2020:
This data from the New York Times (free login required) shows a state by state breakdown of the rate of new infections. As of today, we can see the flattening of the curve, which is leading to several states to open back up – slowly. This link goes to the Florida cases, but you can click on the States menu to switch: New York Times Coronvirus Interactive Map and Case Count
As of May 3rd, 2020: